Travel insights from Latin America
Climate Action Plan and Carbon Labelling for Kagumu Adventures

Author Simon Willis | Published on August 5, 2022
Kagumu Adventures is an educational travel operator striving to become a responsibly-run leader in the industry while inspiring clients and peers to engage in sustainable lifestyles.
Over the past few months, our team has worked to identify and measure carbon emissions related to educational experiences we provide in South America.
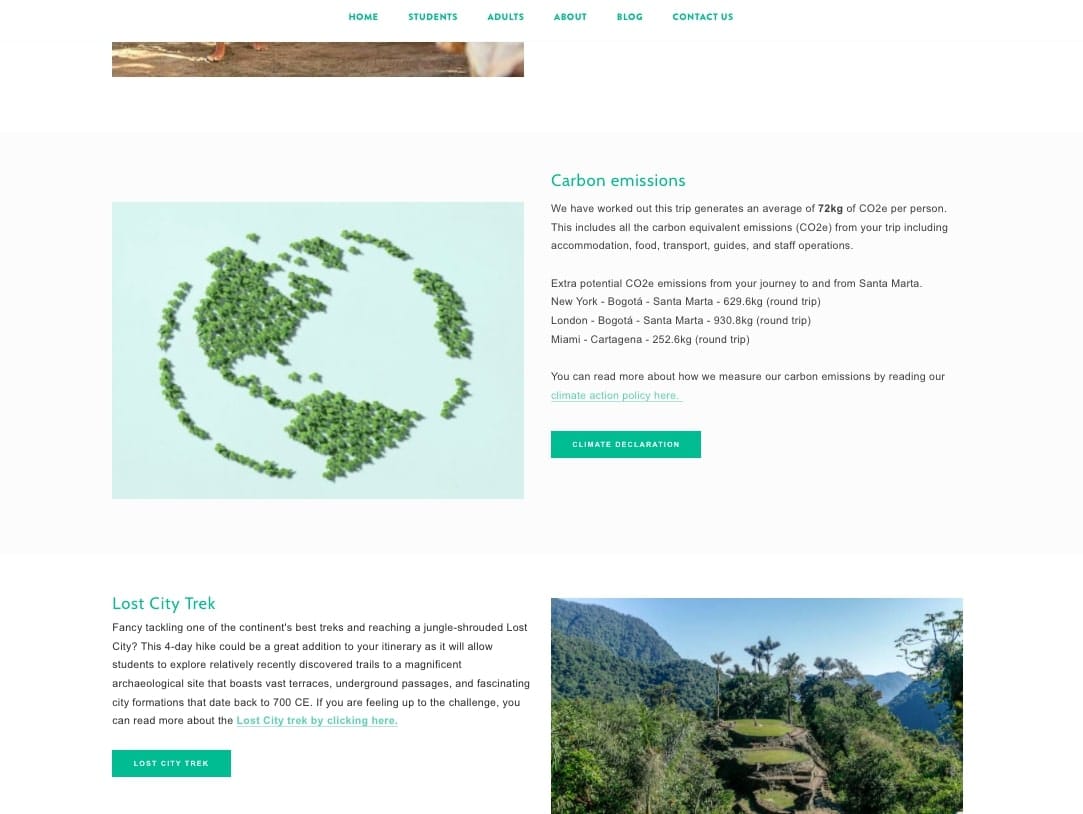
As well as giving clients the ability to see estimated carbon emissions from each educational trip or virtual experience, we have identified how we can lower our carbon emissions and where we need to offset them by donating to certified green energy projects.
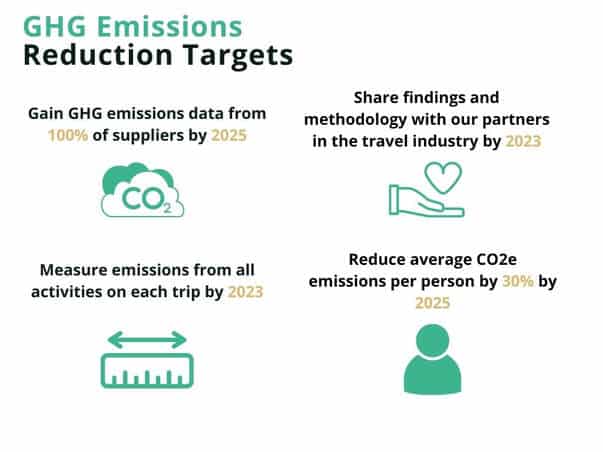
Kagumu’s Climate Action Plan
Aim: to measure our carbon emissions from our operations and the achievable majority of our supply chain to identify ways we can reduce emissions over time, develop low-carbon activities, and inspire others to do the same.
Method: we followed the internationally-recognized GHG corporate standard, measuring our scope 1, 2* and scope 3* emissions. These include our internal and external emissions that occur due to our activities.
*Scope 1 is direct emissions from the activities of our company – fuel combustion on-site such as gas boilers, fleet vehicles and air-conditioning leaks.
**Scope 2 is indirect emissions from the electricity that we purchase for our own use on a day-to-day basis.
***Scope 3 emissions account for all emissions associated with the company’s value chain and that are not accounted for in Scopes 1 and 2.
What is it: an easily digestible declaration of emissions created by our company and our activities.
Before we began to measure, we outlined our commitment to the GHG guiding principles:
- Relevance
- Completeness
- Consistency
- Transparency
- Accuracy
Step-by-step process
Step 1: Decide what we can measure
As our scope 1 and 2 emissions were pretty low, we knew it was essential to include as many scope 3 emissions as possible and justify why certain emissions were omitted.
Remarkably, the scope 3 emissions from a company are still not required in calculations and many companies neglect this even though on average they account for approximately 79% of emissions. We believe this must change.
We decided to use the operational boundary approach meaning we include all activities under our operation in our calculations.
Step 2: Choose a base year
To create an inventory we needed to choose a base year that reflected a “normal” working year for us. This can then provide the basis against which we compare all future GHG emissions. We chose 2019 as this represented our operations on pre-pandemic levels when we were running trips around Latin America.
Step 3: Measuring our scope 1 and 2 emissions:
This was the easy part. To measure this we needed to identify all emissions (like gas) from facilities that we own or operate (offices, vehicles etc), as well as the emissions from purchased electricity.
Step 3: Measuring the emissions from our trips
Thanks to the almost exclusive all-inclusive trips we offer, we concluded that we could accurately measure the emissions from each trip or activity from 2019. To get a complete picture of the emissions, we collected data from the following activities:
Transport in the destination
Transport to and from the destination
Food
Accommodation
Data collection:
To get the most accurate measurements we first looked to gain primary data from our suppliers and customers. If this wasn’t available, secondary data, which is available through national and international research bodies, was used.
The last resort was proxy data from similar activities undertaken by different companies.
It is also important to note that the emissions measured are not just from Carbon Dioxide. Indeed, to measure scope 3 emissions we needed to measure 7 different gases and then convert them into a CO2e (Carbon Dioxide equivalent) factor.
As you will notice with each measurement, we have included:
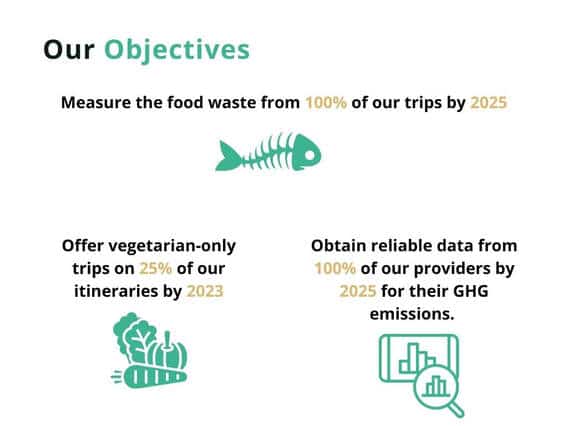
- Climate-related objectives for the future
- Social impact
Transport:
To measure the carbon emissions from transport, we first calculated the exact km of each journey and what mode of transportation we used. We then used the emissions factor of this mode of transport and multiplied it by the total distance. This gave us the CO2e for each journey. If we were unable to match the exact type of vehicle with an emissions factor, we used a standard emissions factor.
Source – Transport_Tool_v2_6
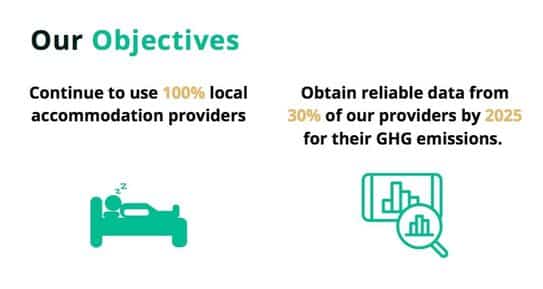
Social impact: we will continue to work with 100% of local transport providers
Accommodation:
To measure the CO2e emissions from accommodation we contacted each hotel, hostel or house owner to attain their scope 1 and scope 2 emissions (basically electricity and gas) and worked out the usage for our group relating to how many days we stayed there.
If this information was not available we used an average emission factor for hotels in Colombia for this source. We were then able to calculate an accurate CO2e factor for each person on each trip.
Many of our trips include eco-lodges and camping in the jungle or mountains. In this case, we contacted our partners to calculate their electricity and gas usage.
In the case of camping, and when electricity was sourced with renewable energy like solar panels, we used 120g LPG (propane or butane) for the gas emissions per person per day. We then multiplied this by the appropriate emission factor.
Social impact: It is important to note accommodation can be a valuable source of income for many families and small business owners. We aim to work with 100% locally-owned hotels, hostels, and lodges, especially those that support the local community and protect the surrounding environment.
We also want to return to the pre-pandemic level of homestays (10%) across our trips by 2025.
Food:
We can measure the associated CO2e emissions from our food consumption by using an online calculator. https://myemissions.green/food-carbon-footprint-calculator/.
As we run all-inclusive trips, we can calculate the carbon emissions associated with the meals we offer. We can then use our average group dietary choices (vegan 10%, vegetarian 10% and meat eaters 80%) to work out the emissions from each trip.
Note: we do not offer beef on any of our trips. Here is an example of what our clients eat on an average day in Colombia and associated CO2e emissions.
Breakfast:
Coffee with milk – two servings
Eggs with tomatoes and onion – one serving
Toast with jam – one serving
Fruit juice – one serving
Lunch:
Fruit juice – one serving
Lentil soup (stock) with carrots
Grilled chicken – one serving
Fries – one serving
Salad (lettuce, tomato, onion, cabbage, beetroot)
Coffee – one serving
Dinner:
Fruit juice (pineapple)
Pork with BBQ sauce – one serving
Rice – one serving
Vegetables (carrots, potatoes, broccoli)
Dessert – fruit with ice cream
Average emissions:
Medium Meat Eater – Average of 5.352kg
Vegetarian (the same but with a vegetable patty to replace the chicken and tofu to replace the pork) – Average of 3.975
Vegan (the same as vegetarian but we removed all non-vegan produce and increased the number of vegetables) – Average of 3.398
Our CO2e emissions are likely to be lower than the actual total as we source almost all of our food locally with limited packaging. However, until we discover a more accurate way to measure this, we will continue using this method. It is also worth noting that our measurements coincide very closely with the averages taken from this study in 2014 – Study Springer.
Did you know? The average plant-based meal has a carbon footprint of 1kg CO2e. That’s almost 4 times less than meals containing beef and lamb! From the very beginning, Kagumu has run a policy of offering zero beef and lamb.
Social impact:
We support responsible locals, projects and companies that are producing low-carbon impact produce and that have a positive impact on the community.
Travel with us and you might visit organic farmer Don Carlos and his family-run restaurant in el Carmen de Viboral while on another trip you could be drinking coffee from Cafe Urbania – a social enterprise that supports displaced families and has a strong commitment to protecting native forests.
Or you might just get the chance to eat at one of our favorite restaurants – Crepes and Waffles – a certified B Corporation that employs women heads of households and supports farmers in Colombia.
Source – myemissions.green/food-carbon-footprint-calculator/
Final base year numbers
We have calculated that our 2019 emissions were:
Scope 1 (gas usage in offices) – 0.22 tonnes of CO2e
Scope 2 (electricity use in offices) – 1.17 tonnes of CO2e
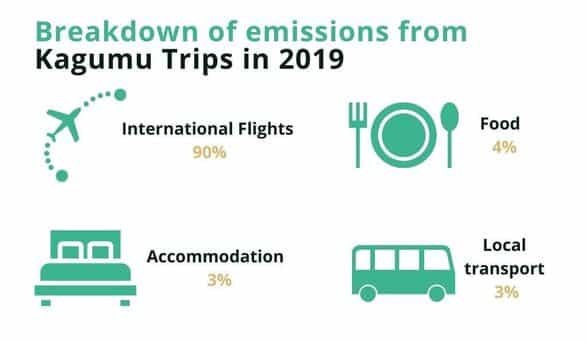
Scope 3 (emissions from trips) – 147 tonnes of CO2e (including international flights)
Step 4: Set our goals
As part of our climate plan, we want to reduce per-person emissions over the coming years. This will, of course, rely on our local partners. While we hold out hope that airlines will become more carbon-friendly through biofuels, we will continue to develop itineraries with fewer flights and shorter haul journeys.
Step 5: Offset what we can’t reduce
In the meantime, we are committed to offsetting our remaining emissions by donating to a certified company that works with carbon credits upon verification from a third party.
Luckily, we began with a mission to offset all our carbon emissions from the international flights you took to visit us, leaving the GHG emissions related to your trips in Colombia, Ecuador or Peru and, of course, our scope 1 and 2 emissions.
Extras:
1. We also maintain our original commitments from the day we began by:
– Eating zero beef across the itineraries
– Using zero single-use plastic
– Working with 95%-100% local providers
– Donating at least 4% of our annual profits to community projects
2. We are part of a number of initiatives including a monthly subscription to Ecologi whereby we top up our carbon offsetting with monthly donations to green projects on the behalf of every employee we have.
Of course, we will continue in the same way and look to improve in the future and welcome any comments or suggestions. Contact our sustainable development officer Bernie Coote – [email protected].
Check out our low-carbon emissions trips around Latin America here.
Sources:
Excel worksheet for base year emissions.
Website to calculate emissions from food.
Website to calculate hotel emissions.
Website to calculate flight emissions.